Find us at booth #83, join us for a harbor side happy hour, or catch Gorish’s talk.

Sept, 16-18 > Learn more

%20(1).avif)
Mamta Tainwala

January 8, 2026

Customer success has evolved from a nice-to-have support function into a revenue-critical engine. For SaaS and subscription businesses, where 90% of revenue comes from existing customers rather than new logos, the ability to measure and improve customer outcomes determines whether you grow or stagnate.
Yet many customer success teams still struggle with a fundamental question: What should we actually be measuring?
The problem isn't a lack of metrics. CS leaders drown in data points from CRMs, product analytics, support tickets, and customer surveys. The challenge is identifying which customer success KPIs actually predict outcomes that matter like retention, expansion revenue, and long-term account health and which are just vanity metrics that look impressive in slide decks but don't drive decisions.
Let’s explore 15 essential customer success KPIs that every revenue team should track in 2026, organized by what they actually measure: growth and retention, customer engagement and relationships, and leading indicators of churn risk.
The economics of SaaS have fundamentally shifted. Customer acquisition costs have increased by 60% over the past five years while sales cycles have stretched longer. In this environment, companies can't afford to treat customer success as an afterthought.
Consider these realities:
Retention is 5-25x cheaper than acquisition. The cost to retain an existing customer is a fraction of what it takes to acquire a new one. Yet many companies still allocate the majority of their budget to sales and marketing rather than customer success.
Net revenue retention drives valuation. Public SaaS companies with NRR above 120% command valuation multiples 2-3x higher than those below 100%. Investors increasingly view post-sale expansion as the strongest indicator of product-market fit and sustainable growth.
Customer success is a revenue function. The days of CS as a cost center are over. High-performing CS organizations directly influence 30-40% of total revenue through renewals, upsells, and expansion. That makes customer success metrics as important as sales KPIs for predicting business performance.
Churn compounds. A 5% monthly churn rate doesn't just mean you lose 5% of customers each month. Compounded annually, that's 46% of your customer base gone. Even small improvements in retention create exponential revenue impact.
The companies that win in 2026 will be those that treat customer success metrics with the same rigor they apply to sales pipeline and marketing attribution. That starts with tracking the right KPIs.
Before diving into specific metrics, let's clarify terminology.
Customer success metrics are any measurable data points related to customer behavior, satisfaction, or business outcomes. You could track hundreds of these: login frequency, feature adoption rates, support ticket volume, email open rates, and so on.
Key performance indicators (KPIs) are the subset of metrics that actually matter for your business goals. These are the numbers that drive decisions, predict outcomes, and connect to revenue.
The difference is crucial. Many CS teams track dozens of metrics but struggle to identify which ones are KPIs worth acting on. A good framework is asking: "If this number changes by 20%, does it require immediate action or change our strategy?"
If yes, it's a KPI. If no, it's just a metric.
For example, "number of logins per month" is a metric. It's interesting data. But "license utilization rate" is a KPI because when it drops below a threshold, it predicts churn risk and requires intervention.
Customer success KPIs fall into three categories, each measuring a different aspect of customer health:
Growth and Retention KPIs measure your ability to keep and expand revenue from existing customers. These are lagging indicators that show results of your CS efforts. Examples include churn rate, net revenue retention, and expansion revenue.
Engagement and Relationship KPIs measure how customers feel about your product and relationship. These combine leading and lagging indicators. Examples include NPS, CSAT, and customer health scores.
Operational KPIs measure the efficiency of your CS team and processes. These are leading indicators that predict future retention and expansion. Examples include time to value, adoption rates, and QBR completion.
High-performing CS teams track metrics from all three categories. Focusing only on retention metrics makes you reactive, you see problems after customers have already decided to leave. Balancing lagging indicators with leading indicators from engagement and operational KPIs lets you intervene proactively.

These are the metrics that matter most to your CFO and board. They directly measure customer success's impact on revenue.
Net revenue retention is the single most important customer success KPI. It measures the percentage of recurring revenue retained from existing customers, including expansion revenue from upsells and cross-sells, minus losses from churn and downgrades.
Formula:
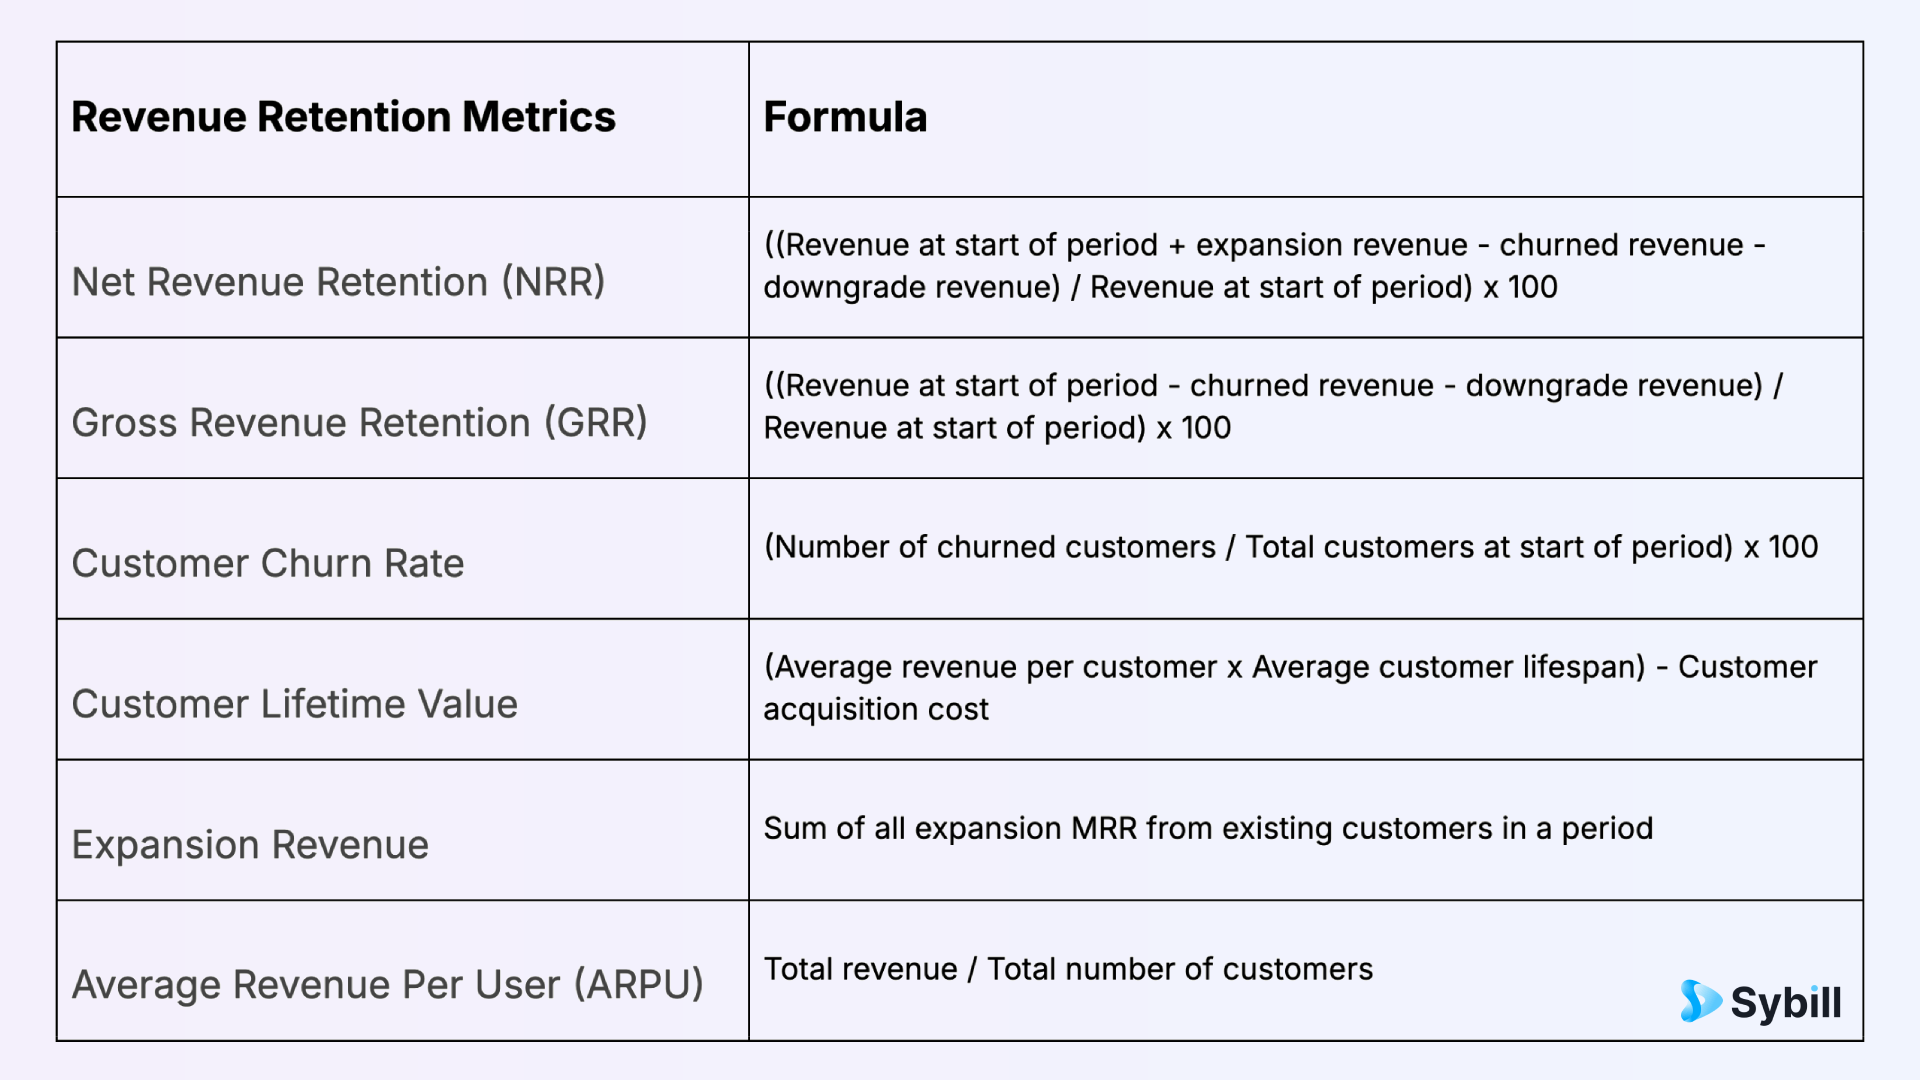
((Revenue at start of period + expansion revenue - churned revenue - downgrade revenue) / Revenue at start of period) x 100
Example:
Start Q1 with $1.5M in ARR from existing customers. During Q1, you generate $300K in expansion revenue, lose $150K to churn, and $50K to downgrades.
NRR = (($1.5M + $300K - $150K - $50K) / $1.5M) x 100 = 107%
Why it matters:
NRR above 100% means you're growing revenue from existing customers faster than you're losing it. This is the holy grail of SaaS metrics. Best-in-class SaaS companies target NRR of 120%+, indicating strong product-market fit and effective land-and-expand strategies.
2026 benchmark:
How to improve:
Focus on three levers simultaneously: reduce churn through proactive health monitoring, minimize downgrades with outcome-based success planning, and increase expansion through strategic account mapping and identifying whitespace opportunities within existing customers.
While NRR includes expansion revenue, gross revenue retention only measures how well you retain existing revenue without considering upsells.
Formula:
((Revenue at start of period - churned revenue - downgrade revenue) / Revenue at start of period) x 100
Example:
Using the same scenario as above but excluding expansion:
GRR = (($1.5M - $150K - $50K) / $1.5M) x 100 = 87%
Why it matters:
GRR tells you if your product is sticky enough to retain customers at their current spend level. High NRR can mask poor retention if you're relying heavily on expansion to cover churn. Strong companies have high GRR (95%+) AND high NRR through expansion.
2026 benchmark:
Churn rate measures the percentage of customers who cancel subscriptions within a given period.
Formula:
(Number of churned customers / Total customers at start of period) x 100
Example:
Start January with 500 customers. Lose 15 during the month.
Monthly churn rate = (15 / 500) x 100 = 3%
Why it matters:
Churn directly erodes your revenue base. A monthly churn rate above 2% for B2B SaaS means significant problems with product-market fit, onboarding, or customer success processes. Remember, churn compounds, that 3% monthly rate becomes 31% annual churn.
2026 benchmark (monthly):
Key distinction:
Track both customer churn (logo churn) and revenue churn (MRR lost). A few large customers churning impacts revenue more than many small customers, so both metrics matter.
CLV represents the total revenue you can expect from a customer throughout their relationship with your company.
Formula:
(Average revenue per customer x Average customer lifespan) - Customer acquisition cost
Example:
Average customer pays $5,000/year, stays for 4 years on average, and costs $3,000 to acquire.
CLV = ($5,000 x 4) - $3,000 = $17,000
Why it matters:
CLV must exceed CAC by at least 3:1 for healthy unit economics. This ratio tells you if your business model is sustainable. Successful SaaS companies in 2026 achieve CLV:CAC ratios of 3:1 to 5:1.
How to improve:
Increase CLV by extending average customer lifespan (reduce churn), increasing average revenue per customer (drive expansion), or reducing CAC through more efficient acquisition.
Expansion revenue measures new recurring revenue generated from existing customers through upsells, cross-sells, and add-ons.
Formula:
Sum of all expansion MRR from existing customers in a period
Example:
In Q2, you generate $75K in upsells to premium tiers, $45K from additional users, and $30K from new product modules.
Total expansion revenue = $150K
Why it matters:
Expansion revenue indicates customers are finding increasing value in your product. It's often easier and more cost-effective to grow revenue within existing accounts than to acquire new customers. Top-performing CS teams drive 20-30% of total new revenue through expansion.
How to improve:
Identify expansion triggers (usage thresholds, milestone achievements, organizational changes), create clear upgrade paths in your product tiers, and train CSMs to identify and articulate expansion opportunities during regular business reviews.
ARPU calculates the average revenue generated per customer account.
Formula:
Total revenue / Total number of customers
Example:
$2.4M in MRR with 400 customers
ARPU = $2.4M / 400 = $6,000/month
Why it matters:
ARPU growth indicates successful upselling and increasing product adoption. Declining ARPU suggests you're either acquiring smaller customers or failing to expand existing accounts. Track ARPU trends by customer segment to identify which cohorts are most valuable.
Revenue metrics are lagging indicators, they tell you what already happened. Engagement KPIs are leading indicators that predict which direction revenue is heading.
NPS measures customer satisfaction and likelihood to recommend your product to others.
How to measure:
Ask customers: "On a scale of 0-10, how likely are you to recommend us to a friend or colleague?"
Categorize responses:
Formula:
Percentage of promoters - Percentage of detractors
Example:
Survey 200 customers: 100 promoters (50%), 60 passives (30%), 40 detractors (20%)
NPS = 50% - 20% = 30
Why it matters:
NPS correlates strongly with renewal rates and organic growth through referrals. Companies with NPS of 70+ see significantly higher growth rates than those below 30. However, NPS is most valuable when paired with qualitative feedback explaining the scores.
2026 benchmark:
Pro tip:
Always follow up with "What's the main reason for your score?" The qualitative insights matter more than the number itself.
CSAT measures satisfaction with specific interactions or aspects of your product/service.
How to measure:
Ask customers after key touchpoints: "How satisfied were you with [interaction/feature]?"
Use a 1-5 or 1-10 scale, then calculate the percentage of satisfied responses (typically 4-5 on a 5-point scale, or 8-10 on a 10-point scale).
Formula:
(Number of satisfied customers / Total respondents) x 100
Example:
After onboarding, 85 out of 100 customers rate their experience 4 or 5 out of 5.
CSAT = (85 / 100) x 100 = 85%
Why it matters:
Unlike NPS, which measures overall sentiment, CSAT helps identify specific pain points in the customer journey. Track CSAT at key moments: after onboarding, following support interactions, after QBRs, and post-renewal.
2026 benchmark:
Customer health scores aggregate multiple signals into a single indicator of account risk and opportunity.
Common components:
Example scoring model:
Assign scores 0-100 for each component, apply weights, sum to get overall health score.
Why it matters:
Health scores provide an at-a-glance view of account status, allowing CS teams to prioritize interventions. Customers with declining health scores are 3-5x more likely to churn within 90 days, making this a critical early warning system.
How to use:
Segment customers into tiers (Green: 80-100, Yellow: 50-79, Red: 0-49) and create intervention playbooks for each tier. Automate alerts when accounts drop below thresholds or show sudden declines.
Adoption rate measures how many of your product's core features customers are actually using.
Formula:
(Number of key features used / Total key features available) x 100
Example:
Your product has 10 core features. Customer uses 7 of them regularly.
Adoption rate = (7 / 10) x 100 = 70%
Why it matters:
Higher adoption correlates directly with retention and expansion. Customers who use more features see more value, making them stickier and more likely to expand. Track adoption at individual feature level to identify which capabilities drive the most value.
2026 benchmark:
Actionable insight:
Don't just track adoption, understand why low-adoption customers aren't using features. Sometimes it's training gaps. Other times, customers don't need those features, which might indicate product-market fit issues or wrong-fit customer profiles.
License utilization measures what percentage of purchased seats/users are actively using your product.
Formula:
(Number of active users / Number of purchased licenses) x 100
Example:
Customer purchased 50 licenses. Only 35 users logged in during the last 30 days.
Utilization rate = (35 / 50) x 100 = 70%
Why it matters:
Low utilization is both a churn risk and an expansion opportunity. If customers aren't using what they paid for, they're likely to downgrade at renewal. But if they're at 90%+ utilization, they're ready for an upsell conversation.
Sweet spot:
Target 75-85% utilization. Below 70% indicates adoption challenges. Above 90% presents expansion opportunity.
These metrics measure how effectively your customer success team operates. They're leading indicators of future retention and expansion performance.
Time to value measures how quickly new customers achieve their first meaningful outcome with your product.
How to measure:
Define what "value" means for your product (first report generated, first automation created, first milestone achieved), then track days from contract signature to that moment.
Example:
For a sales intelligence platform, first value might be "first qualified lead generated." Average time from signup to first lead: 14 days.
TTV = 14 days
Why it matters:
Customers who experience value quickly are significantly more likely to become long-term accounts. Best-in-class SaaS companies achieve initial value realization within 14 days of onboarding. Longer TTV correlates with higher early-stage churn.
2026 benchmark:
How to improve:
Identify the critical path to value and remove friction. This might mean simplifying onboarding, providing better self-service resources, or assigning white-glove onboarding support for higher-value customers.
CRC measures how much you spend to retain each customer.
Formula:
Total annual cost of CS operations / Number of customers
Example:
CS team costs $800K annually (salaries, tools, training). You have 400 customers.
CRC = $800K / 400 = $2,000 per customer
Why it matters:
CRC should be significantly lower than customer acquisition cost (ideally 1/5 to 1/3 of CAC). If retention costs more than acquisition, your business model has fundamental problems.
How to optimize:
Use AI and automation to reduce CS team workload on routine tasks. Sybill's AI assistant automatically handles meeting notes, follow-up emails, and CRM updates, allowing CSMs to focus on high-value activities like relationship building and strategic planning instead of administrative busywork.
QBR (Quarterly Business Review) completion rate measures what percentage of scheduled customer reviews actually happen.
Formula:
(Number of completed QBRs / Number of scheduled QBRs) x 100
Example:
Scheduled 120 QBRs this quarter. Completed 96.
QBR completion rate = (96 / 120) x 100 = 80%
Why it matters:
QBRs are high-impact touchpoints that strengthen relationships, demonstrate ROI, and identify expansion opportunities. Low completion rates signal either customer disengagement or poor CS team prioritization. Customers who attend regular QBRs have 30-40% higher retention rates than those who don't.
Target:
Aim for 85%+ completion rate for high-value accounts. Track separately by customer tier, as enterprise customers typically have higher QBR attendance expectations than SMB.
How to improve:
Make QBRs valuable rather than obligatory. Focus on insights and strategic planning rather than metrics review. Learn how to nail your QBRs with preparation strategies that ensure every review drives actionable outcomes.
First contact resolution measures what percentage of customer issues are resolved in the initial support interaction.
Formula:
(Issues resolved on first contact / Total support tickets) x 100
Example:
Resolved 340 tickets on first contact out of 400 total tickets.
FCR = (340 / 400) x 100 = 85%
Why it matters:
High FCR indicates efficient CS operations and strong product knowledge among your team. It also improves customer experience by reducing frustration from repeated back-and-forth. Every additional touch required to resolve an issue decreases CSAT by 10-15%.
2026 benchmark:
Tracking 15 KPIs sounds overwhelming. The key is building a tiered dashboard that surfaces the right metrics for different audiences and use cases.
For leadership and board meetings, focus on:
These metrics tell the revenue story and company health at the highest level.
For CS directors and VPs managing the team:
These metrics help CS leaders allocate resources, identify trends, and coach their teams.
For front-line customer success managers:
CSMs need actionable, account-specific information to drive their daily activities.
The best CS dashboards share common characteristics:
Real-time or near-real-time updates. Stale data leads to delayed interventions. Use tools that automatically refresh metrics daily or weekly depending on velocity.
Clear visual hierarchy. Use color coding (red/yellow/green) to indicate status at a glance. Don't make people dig through numbers to identify problems.
Trend indicators. Show whether metrics are improving or declining over time, not just current state. A 95% GRR is great, but if it was 98% last quarter, that trend demands attention.
Comparative context. Display metrics alongside targets, benchmarks, or historical averages so stakeholders can quickly assess performance.
Drill-down capability. Allow users to click into aggregate metrics to see account-level detail. This helps diagnose root causes rather than just identifying symptoms.
Even teams that track the right metrics often make implementation mistakes that reduce their effectiveness.
Having 30 metrics on your dashboard means you're not actually tracking KPIs, you're just collecting data. More metrics don't equal better insights. They create analysis paralysis.
Solution:
Start with 5-7 core KPIs aligned to your business stage and goals. Add more only when you've proven you can act on the existing ones.
Many CS teams only track lagging indicators like churn and NRR. By the time these metrics decline, customers have already made the decision to leave.
Solution:
Balance lagging indicators (what happened) with leading indicators (what's likely to happen). Health scores, product adoption, and engagement metrics predict future churn before it appears in retention numbers.
Averaging metrics across all customers hides important variation. Your enterprise and SMB segments probably have wildly different retention profiles, usage patterns, and expansion potential.
Solution:
Segment every KPI by customer tier, vertical, acquisition channel, and cohort. This reveals which segments are healthy and which need intervention.
Tracking metrics without clear owners and intervention protocols is performance theater. Numbers on dashboards don't improve outcomes. Action does.
Solution:
For every KPI, define: what threshold triggers action, who owns the response, and what specific interventions will be deployed. For example: "When customer health score drops below 60, assigned CSM receives automated alert and initiates recovery playbook within 48 hours."
CS teams that manually compile metrics from multiple sources spend more time building reports than acting on insights. This isn't sustainable at scale.
Solution:
Invest in tools that automatically aggregate data from your CRM, product analytics, support platform, and financial systems. Sybill's AI platform automatically captures data from customer calls, emails, and meetings, then updates CRM fields and generates insights without manual effort from CSMs.
The customer success function in 2026 looks fundamentally different than it did even two years ago, largely because AI has automated the busywork that consumed 60-70% of CSM time.
Traditional challenge: CSMs spent hours after meetings documenting notes, updating CRM fields, and summarizing key points for their team.
AI solution: Conversation intelligence automatically transcribes meetings, identifies action items, extracts key information (pain points, expansion signals, risk factors), and updates CRM records. CSMs can focus entirely on the customer during meetings instead of typing notes.
Traditional challenge: By the time churn shows up in retention metrics, the decision is already made. CS teams were reactive rather than proactive.
AI solution: Machine learning models analyze hundreds of behavioral signals to predict churn risk 60-90 days before renewal. This gives CSMs time to intervene with targeted retention plays.
Traditional challenge: High-touch customer success only worked for enterprise accounts. SMB customers received generic, low-touch experiences.
AI solution: AI-powered tools can personalize communications, identify the right time to reach out, suggest relevant content, and automate follow-ups based on customer behavior. This enables "high-touch" experiences for mid-market and SMB segments.
Traditional challenge: CS leaders looked at dashboards full of numbers but struggled to identify root causes or prioritize actions.
AI solution: AI analyzes patterns across metrics to surface insights like "NPS decline in Q2 correlates with slower onboarding times in Q1" or "Customers who attend QBRs have 3x higher expansion rates, suggesting we should prioritize QBR completion."
The companies winning at customer success in 2026 aren't just tracking better metrics, they're using AI to act on those metrics faster and more effectively than humans could alone.
The metrics you prioritize should evolve as your company matures.
Focus: Product-market fit and learning
Priority KPIs:
At this stage, you're validating that customers can achieve outcomes with your product. Prioritize fast iteration based on feedback over complex tracking systems.
Focus: Scaling processes and improving unit economics
Priority KPIs:
You've proven PMF. Now focus on retaining customers efficiently and building repeatable processes that scale. Implement health scores and early warning systems.
Focus: Predictable growth and efficiency
Priority KPIs:
At scale, you need sophisticated metrics to optimize across hundreds or thousands of accounts. Invest in automation and AI to maintain quality as you grow.
Understanding metrics is one thing. Improving them is another. Here are tactical plays for moving your key KPIs in the right direction.
Implement proactive health monitoring. Don't wait for customers to tell you they're unhappy. Use leading indicators (declining usage, skipped meetings, low health scores) to identify and engage at-risk accounts before they churn.
Create expansion playbooks. Document repeatable triggers for upsell conversations (usage thresholds, achieved milestones, organizational changes) and train CSMs to identify and act on these signals.
Optimize pricing and packaging. Analyze which customer segments have highest expansion rates and lowest churn. Design upgrade paths that feel natural rather than forced.
Redesign onboarding for speed. Map the shortest path from signup to first value, then remove every obstacle. Consider offering white-glove onboarding for high-value customers.
Build in-app guidance. Use tooltips, walkthroughs, and contextual help to guide users to high-value features without requiring human intervention.
Celebrate milestones. Gamify the experience by acknowledging when customers achieve key milestones. This reinforces value and encourages deeper exploration.
Close the feedback loop. When customers give negative feedback, always follow up to understand the issue and communicate how you're addressing it. This often converts detractors to promoters.
Focus on moments that matter. You can't deliver perfect experiences 100% of the time. Prioritize the touchpoints that most influence perception: onboarding, critical support interactions, renewals, and QBRs.
Make it easy to get help. Long wait times and complex support processes tank satisfaction scores. Invest in self-service resources and responsive support for common issues.
Automate repetitive work. CSMs who spend 10 hours per week on manual CRM updates, note-taking, and follow-up emails have less time for strategic customer work. Customer success tools that leverage AI can reclaim those hours.
Segment your customer base. Not all customers deserve equal attention. Build a tiered model (high-touch for enterprise, low-touch for SMB) and allocate CSM time accordingly.
Create playbooks for common scenarios. Don't reinvent the wheel for every at-risk account or expansion conversation. Document what works and make it repeatable.
Technology and dashboards are necessary but insufficient. The best CS organizations build cultures where metrics drive daily decisions at every level.
Display key KPIs in prominent places like team dashboards, Slack channels, weekly all-hands meetings. When everyone sees the numbers regularly, they become part of the shared language.
When NRR improves or churn decreases, celebrate publicly. This reinforces that metrics matter and motivates continued focus on improvement.
Schedule monthly or quarterly deep-dive sessions where the CS team analyzes trends, identifies root causes, and brainstorms improvements. These shouldn't be blame sessions, instead they're collective problem-solving opportunities.
While avoiding toxic over-optimization, tie individual CSM performance reviews and compensation to relevant KPIs. This could include their portfolio's health score distribution, retention rate, and expansion revenue.
Encourage your team to question metrics that don't pass the smell test. If a dashboard shows great health scores but customers are churning, something's wrong with how you're measuring health. Metrics should reflect reality, not obscure it.
Net Revenue Retention (NRR) is the single metric that best captures overall customer success performance. It combines retention, expansion, and churn into one number that directly ties to revenue growth. Companies with NRR above 120% are typically valued 2-3x higher than those below 100%, making it the KPI that matters most to investors and leadership. However, NRR is a lagging indicator. To actually drive NRR improvement, you need to track and act on leading indicators like customer health scores, product adoption rates, and time to value that predict future retention and expansion.
Start with 5-7 core KPIs aligned to your business stage and goals, then expand only as your team proves it can act on the data. A common mistake is tracking 20+ metrics but not acting on any of them. The right number depends on your team size and maturity: early-stage companies should focus on 5 core metrics (churn, NRR, product adoption, time to value, and CSAT); growth-stage companies can handle 8-10 metrics across retention, engagement, and operational efficiency; enterprise companies may track 12-15 metrics with dedicated analytics resources.
This depends on your company model and CS team maturity. In traditional structures, CS owns retention and gross revenue retention while sales owns new bookings. However, leading companies are increasingly giving CS ownership of net revenue retention, which includes expansion revenue from upsells and cross-sells. This makes sense because CS teams often have the best visibility into expansion opportunities within existing accounts. If your CS team will own revenue targets, ensure they have: (1) proper compensation structures with variable pay tied to revenue outcomes, (2) tools and training for having commercial conversations, (3) clear rules of engagement with sales on which team owns which type of expansion, and (4) access to pipeline and forecasting tools, not just health dashboards. Many companies use a hybrid model where CS sources expansion opportunities and partners with AEs to close complex upsells, with revenue credit split between teams.